Digital product
SaaS Metrics Dashboard
Twenty-four months of actuals turned into the metrics investors ask for: an MRR movement bridge, net revenue retention, the quick ratio, and a diagnosis of whether you have a growth problem or a leak.
xlsx· v2.0· 101.1 KB
What you’ll get
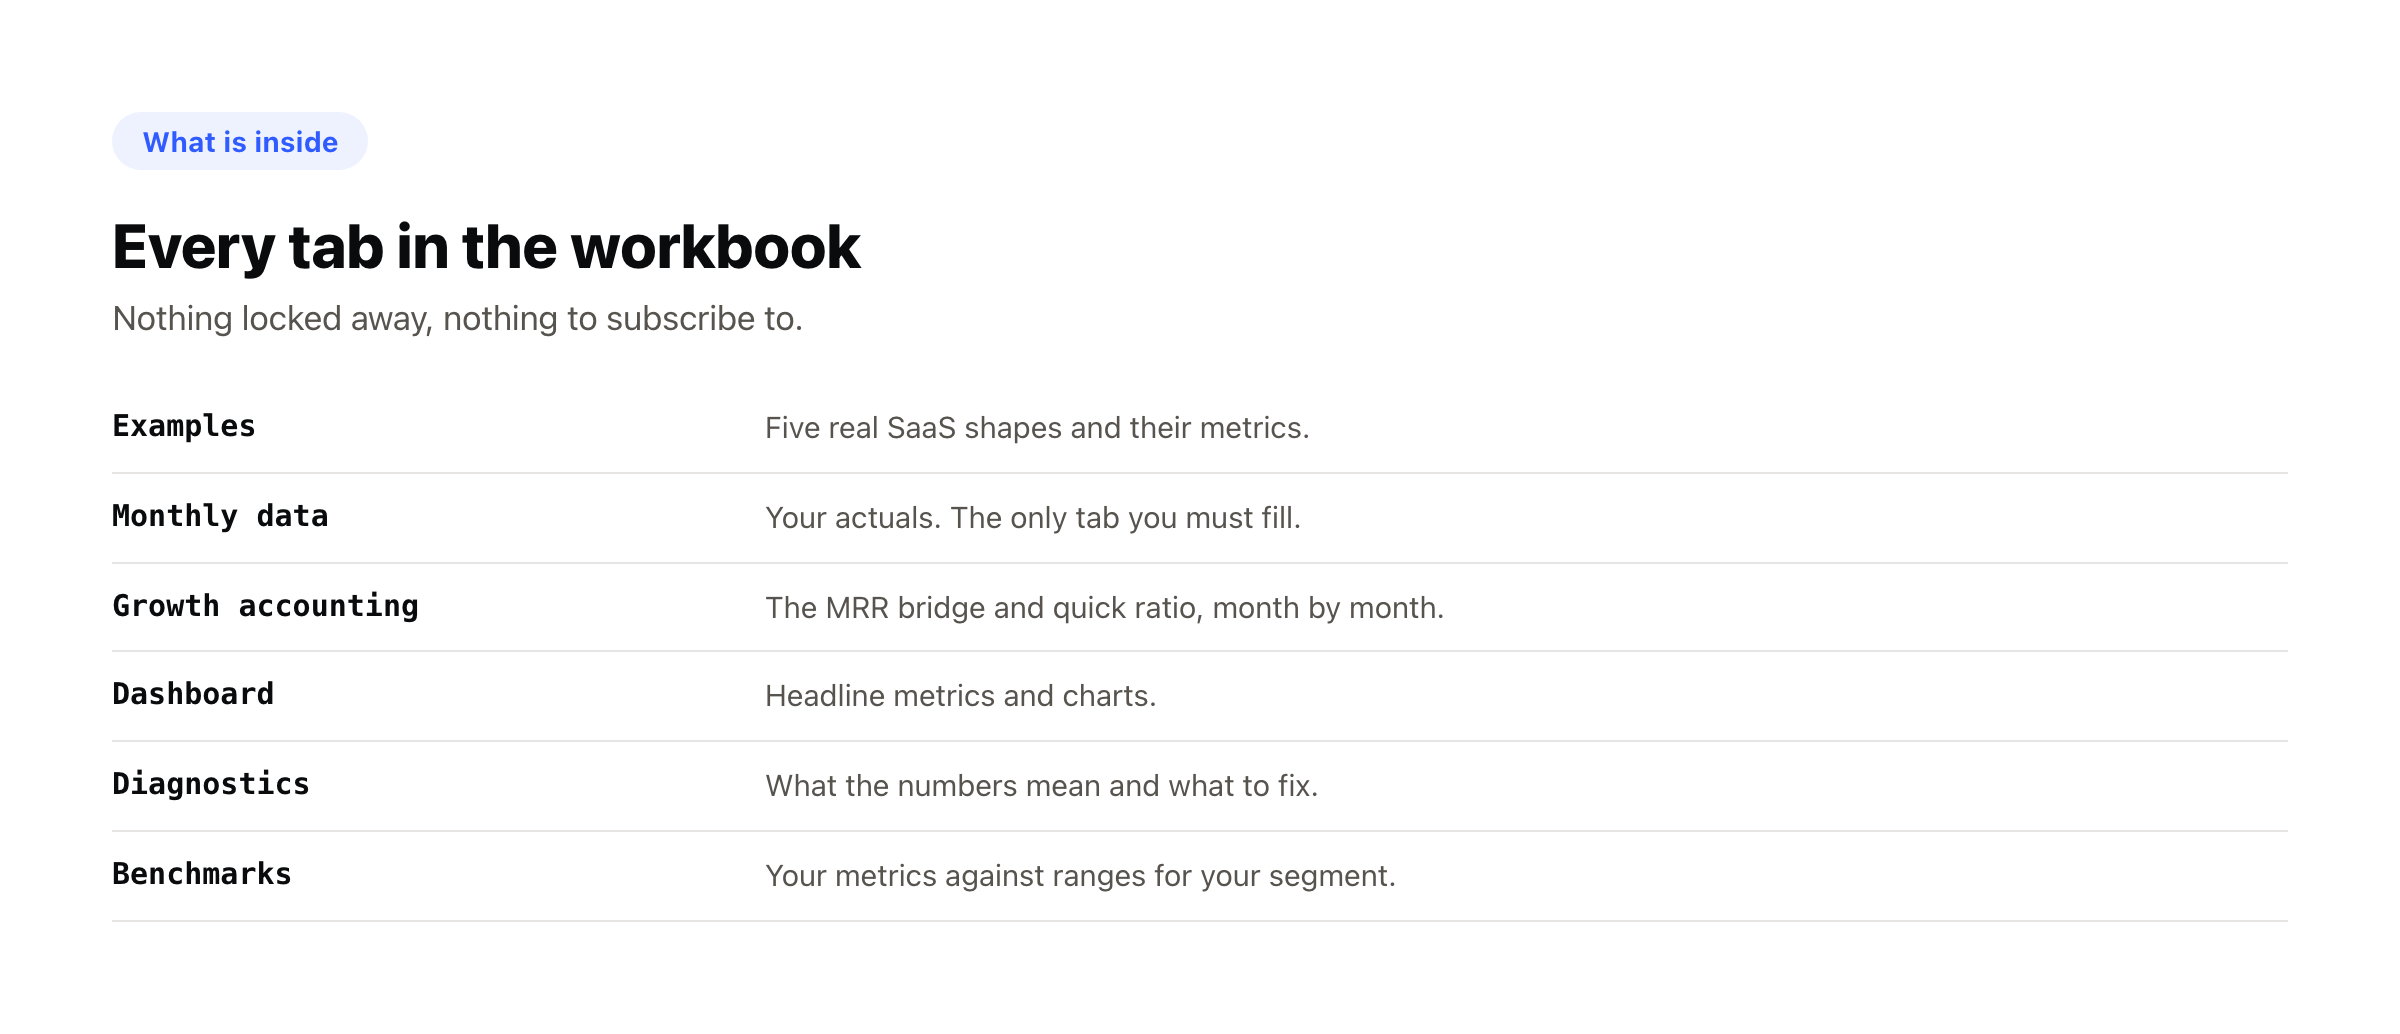
- Enter your actuals on Monthly data, one row per month. Only the yellow columns.
- Growth accounting splits every month into new, expansion, contraction and churn.
- Dashboard shows the headline metrics; Diagnostics explains what they mean.
- Examples holds five real SaaS shapes to compare yourself against.
- 10 tabs, including a live dashboard, a diagnostics read-out and benchmarks
- Excel workbook with every formula visible and unlocked inputs, so you can change anything
- Worked examples built in: five filled scenarios you can switch between and edit
- Yours to keep. Works offline, no subscription, no account needed to open it